Project schedule is always an important part of an Engineering & Construction (E&C) project. But it is often overrated.
Simply creating a schedule at the beginning of the project is not enough – if you don’t track the actual progress of the work against it. It is important for a project manager to create a schedule at the beginning of the project and then measure actual work timeline against it, as the project moves ahead.
Creating an objective project plan is not just limited to scheduling. Normally a project schedule highlights all critical activities. The project manager then focuses on those critical activities to makes sure project is completed on time.
But often this can approach is misleading.
Critical Path analysis isn’t enough for objective planning
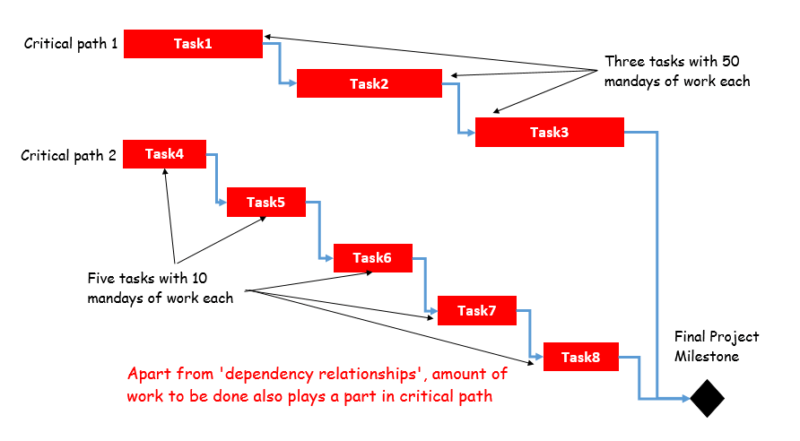
Critical activities in a Gantt chart are only based on task timelines. But timelines on Gantt chart do not account for the amount of work to be done, in any way.
For example – consider two tasks on two separate task chains on a Gantt chart. Both chains are critical paths. But the quantum of work in task 1 (and chain1) is significantly more than task 2 (and chain2). Clearly task 1 and critical path chain1 needs to be done on highest priority.

Evidently, a project manager / planner needs to go a step beyond Gantt chart scheduling and also start accounting for the quantum of work in each task from that project schedule.
Difficulty in measuring the quantum of work – apples vs oranges
Scope of work in a construction project is usually quite complex with a variety of activities to be done – like, excavation, foundation, brickwork, flooring, electrical work etc.
Each activity is measured with a different unit of measurement (UOM). So how to compare 30 Cubic Meters of excavation work with 300 Kg of brickwork? How to decide which represents more work?
When planning for a project, you have to deal with hundreds of such different activities. Clearly you will need a system to boil down all SOW (scope of work) numbers to a single unit.
One option is to use efforts in terms of mandays for each activity. Mandays indicate the quantum of work to be done in each activity – and this approach is perfectly fine for a construction project, mostly requiring manual labor.
But some activities need high skilled labor with higher daily wages. Further, some activities are a combination of material costs, machinery cost and labor (mandays). Then it doesn’t make a lot of sense to simply use mandays numbers.
The other option is to directly use the overall costs of each activity to compare between them. Combined material and labor costs are a reflection of how much resources need to be pumped into an activity.
Task weightages
The SOW of a task when converted to percent basis, becomes the ‘weightage of that task’. Task weightages are often used in earned value analysis and for plotting S curve for a project.

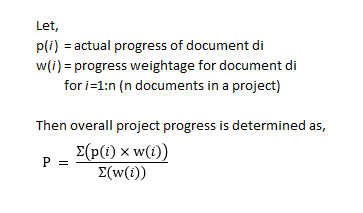
Earned value analysis at task level indicates the amount of work for a single task. But there are many such tasks in a construction project. A weighted average of amount of work done for all tasks is calculated using the task weightages.

This weighted average is the most objective representation of the progress achieved or amount of work done at the project level.
For objectively planning a construction project, a project / planning engineer needs to spend time on Gantt chart as well as scope of work or task weightages.
Combining the knowledge of critical path with the knowledge of SOW values will ultimately lead to an objectively sound project plan.
Combining timelines and SOW in an S Curve
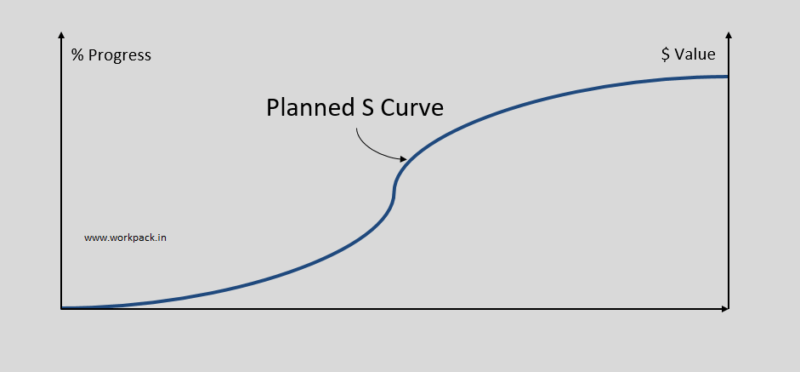
An S Curve is a plotted graph of cumulative ‘earned value’ at project level against timeline.

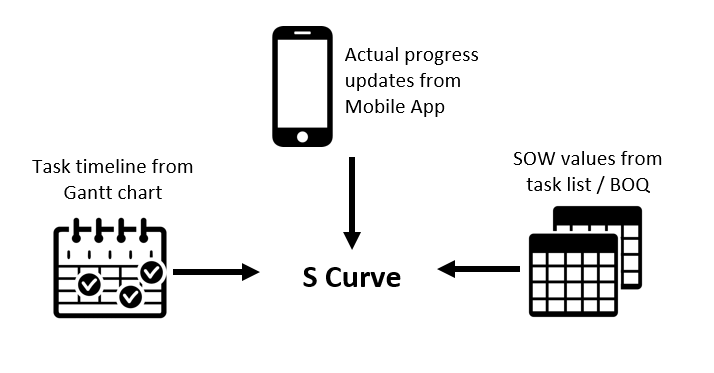
Cumulative values of earned value are obtained by taking weighted average of planned progress for all tasks – progress which is derived from planned timeline from project Gantt chart.
So S curve is indeed a tool that combines project schedule with SOW values and it is hence a valuable tool for objective planning as well as progress tracking.
Tracking actual progress on S curve
The planned S curve is developed by plotting the planned values of cumulative progress against project timeline. If actual progress values are plotted against timeline in a similar way, we will get the actual S curve.
This actual S curve is based on the actual progress for different tasks and their overall quantum of work (which is captured in the task weightage numbers).

Challenges in objectively creating and tracking S curve
S curve is a great tool for objectively planning a construction project. But it requires some ground work to generate an S curve.
- You have to first create a project schedule (Gantt chart)
- List down scope of work (SOW) for all project activities
- Boil down SOW value to a single unit (e.g. mandays, $) or % values
- Calculate weighted averages of cumulative progress
- Plot the cumulative progress values against timeline.
Calculating SOW and task weightages is already challenging and then you have to combine those values with the project schedule.
Once the S curve is created, you need to track the actual progress for each and every task. Then plot the weighted averages of actual progress values against project timeline, to compare the actual progress against planned progress.
Construction projects are inherently quite complex – involving different types of activities, multiple stakeholders, scattered teams etc.
That further contributes to the difficulty of tracking actual progress of construction activities in real time.
Digital solution
Construction project teams often use emails and excel sheets to keep track of the actual work being done. If the same emails and excel sheets are placed on a digital platform and connected to the project schedule, the S curve plotting and tracking process can be drastically simplified and automated.
![]()
WorkPack is one such online platform combining – spreadsheets, emails, mobile apps, shared drives and project schedule. Many construction managers have already leveraged this rich cluster of digital tools to help their teams create and track S curves.
Do you think your team can also benefit? Find out by setting up a free trial account.
Let us know if you would like to schedule a free consulting session with our team.

No Comments