Complexity in construction projects
Construction projects are quite complex in nature.
As a construction project manager, you have to simultaneously deal with multiple types of construction activities – scaffolding, brickwork, excavation, flooring, plumbing etc.
Moreover you need to coordinate with multiple stakeholders – architect, structural consultant, material suppliers, subcontractors etc.
All of these activities and stakeholders are scattered over different locations.
Connecting all the stakeholders
Connecting all these dots and creating a coherent picture takes a lot of effort from the construction project manager.
Construction managers frequently rely on emails and excel sheets to coordinate and communicate with other stakeholders.
For example – consider a site engineer who is monitoring all construction activities going on the site. He records details updates of all the work done throughout the day in an excel sheet – on daily basis. Then he emails that excel sheet to the project manager.
This way, the project manager has a complete record of everything that has happened on the site.
But all those records are scattered in hundreds of excel files exchanged in hundreds of emails – for a single project.
In a nutshell, emails and excel sheet are barely effective and not at all efficient for tracking construction work. They fail to tell the complete story of what has happened in a project till date.
Single dashboard for simplification
On the other hand, it is possible to create a coherent picture of what has happened in a project, using a single dashboard or a single report file.
That dashboard should show –
- How much of work was planned to be done till date
- How much of work has actually been done
- What is the value of actual work done (earned value)
- What is the total cost incurred till date to get that work done
- Resources used till date
- Forecast resource requirements for the remaining work
When all these stats are put together, they can tell a comprehensive story of – what was planned to be done, how far we have progressed, what has been our productivity and how many resources are needed for the remaining work.
In a nutshell, such a dashboard explains the overall health of the project.
Using S Curve for construction dashboard
S curve is a popular project management tool based on earned value management, which can be used as an integrated construction tracking dashboard.
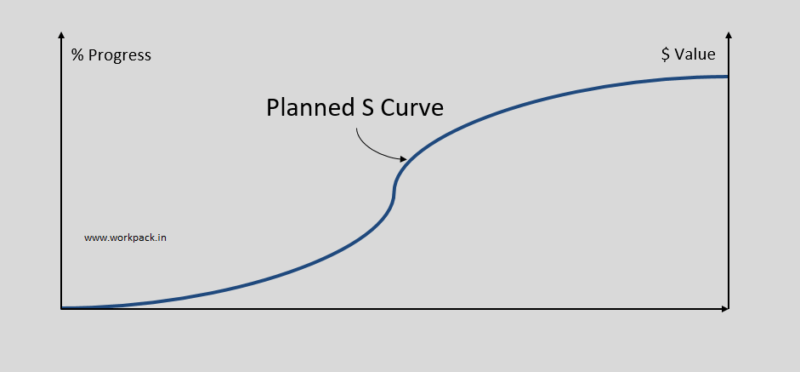
S Curve plots cumulative value of % progress or work done against timeline.
Planned Vs Actual progress
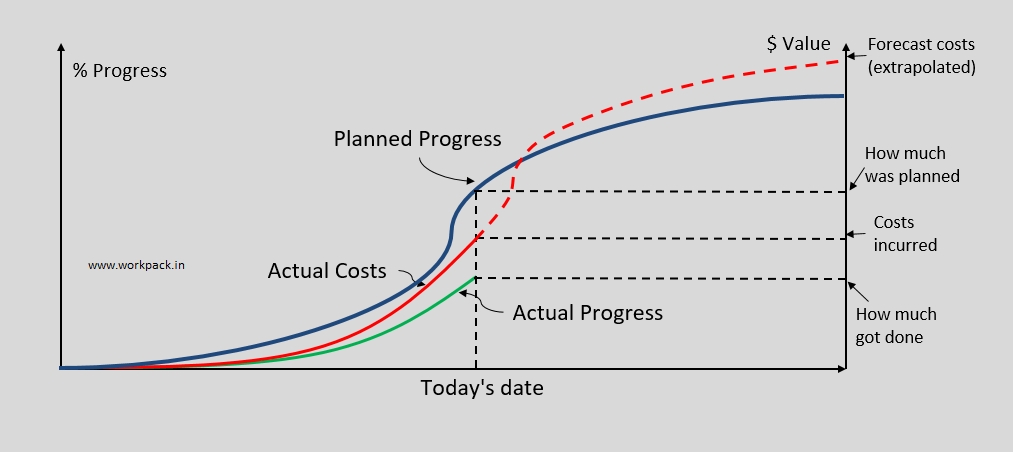
When the planned value of % progress or work to be done are plotted cumulatively against timeline, what we get is a planned S Curve.
When actual values of % progress or actual work done are plotted on the same graph, we can compare – how work was supposed to progress with time AND how it has actually progressed.
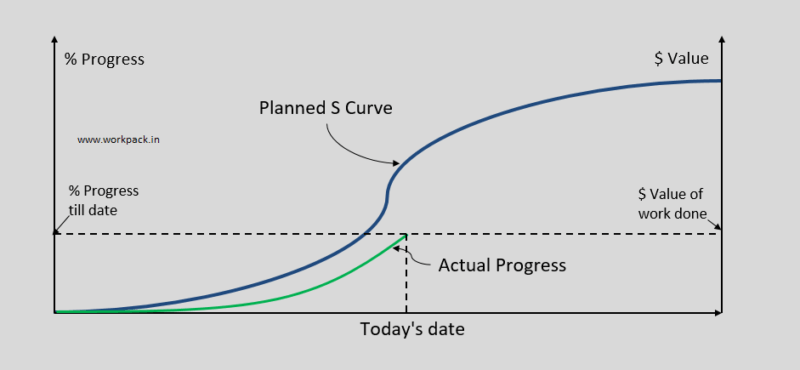
This is a very telling picture of how the project team has actually fared against the project schedule.
Actual Progress Vs Costs
Next, if you plot the actual cumulative costs against timeline, you will understand what the productivity has been over time.
Actual costs can be plotted in two ways –
- Actual costs as % of budgeted costs
- Actual costs in $ terms
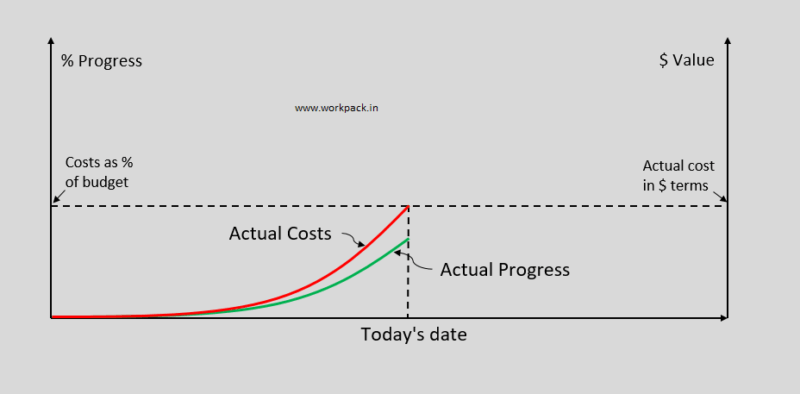
But if you use $ values, make sure to convert the actual work done to a $ value as well. That will represent the value of work done till date.
Understanding progress and productivity
All 3 curves put together on the same graph, will tell a very comprehensive story of –
- What was planned
- How much has been done
- $ Value of work that has been done
- How much costs have been incurred
- Forecast cost for resources required for remaining work
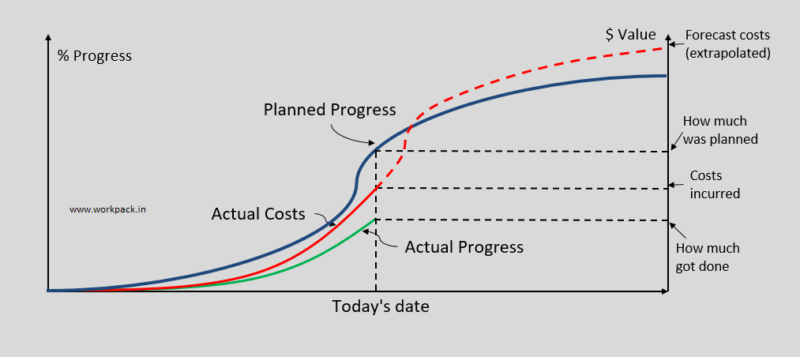
The actual costs till date can be extrapolated to determine the expected costs of remaining work to be done.
That will forecast the costs of resources needed to do the remaining work.
Tools for creating S Curve
There are many project management tools that can help to create an S Curve for tracking a construction project –
- Gantt chart helps in creating a project schedule and define planned timeline for different construction activities
- Spreadsheets (Excel or other online spreadsheets) are widely used to collate actual progress and actual costs data from different stakeholders
- Usually these spreadsheets are communicated within the team using emails / shared drives etc.
These tools can be used independently. But that will require significant manual efforts from the construction project manager to connect the data from all of those silo tools.
Otherwise, you can integrate all of them using an online platform like WorkPack.
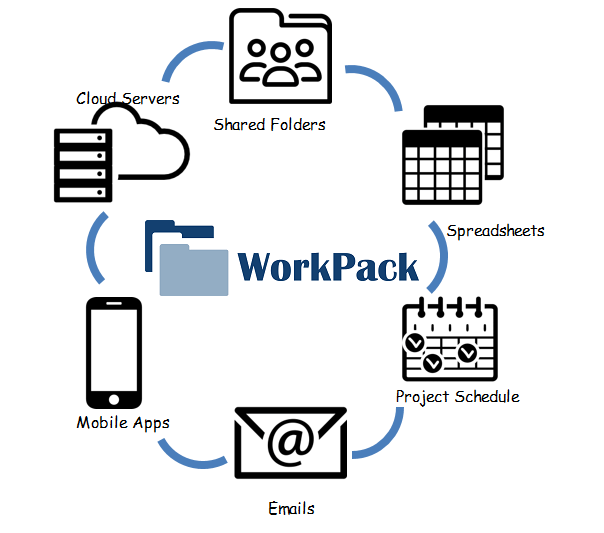
WorkPack connects project schedule, spreadsheets, shared drive, mobile apps and emails on a single platform. So using all the ground level progress tracking data, WorkPack can generate an S Curve report depicting – Planned Progress Vs Actual Progress Vs Actual Costs, at the click of a button.
WorkPack’s S curve has already helped multiple construction project managers across different industries. Can it help your team as well? Find out with a free trial account.
Let us know if you want to schedule a free one time consulting session.

1 Comment
Dr. Saty Satyamurti
August 3, 2018
The S curve can be used for Engineering Progress, Procurement Progress as well. It depends on the quality of information received and used in the software.Primavera P6 and other Planning and Scheduling software can do the same job.