Earned value management has been a popular project management technique for quite some time. Based on the earned value management for Engineering & Construction (E&C) projects, S-curve reports have also been used in E&C industry for quite a while.
Creating a planned S Curve with scheduled timeline of different project activities is rather straight forward.
But, it takes a lot of time and effort to plot the actual progress and costs in this S Curve format – mainly because, first you have to gather the actual progress and cost data from all project team members.
So are there any simple tools that can help in easily plotting planned and actual S curve reports for a construction project?
Creating planned S curve
Planned S curve is simply the ‘planned timeline of cumulative project progress’. In other words, S curve depicts how a project is supposed to progress over its planned timeline.
Overall project progress is simply the weighted average of planned progress of all project activities. So for a project level S curve, planned progress timelines of all project activities are needed.
Gantt cart

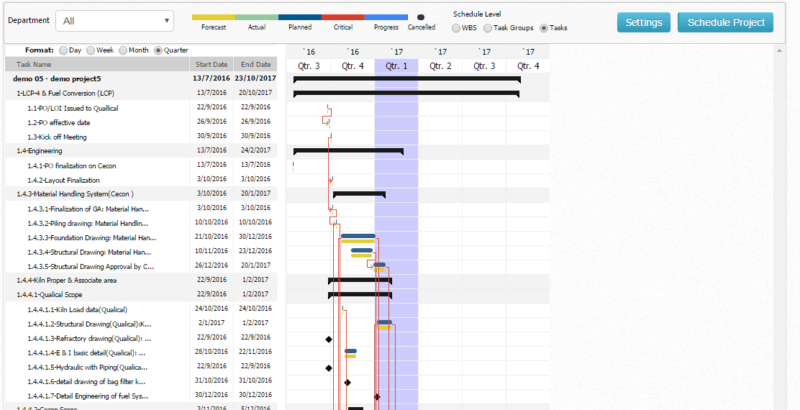
Normally the planned timelines for different tasks would come from the project schedule in Gantt chart format.
The project Gantt chart provides timeline (start & end dates) for all project activities. If you assign different ‘weightages’ to these activities and then take a weighted average of cumulative progress of all the tasks, it would represent the overall project progress at that instant.
When you plot the cumulative project progress values over the project timeline – you get the planned S curve.
So apart from the planned timeline taken from the Gantt chart, the other important factor in this the task weightage or weight factor.
Task weight factor
Each task in a construction project is different. So each task has different importance or ‘weightage’ with respect to its contribution to overall project progress.
This importance of a task is captured in the ‘weight factor’ or ‘weightage’ of that task.
This way the % progress of a task multiplied by ‘weightage’ results in the contribution of that task to % progress at project level.
And when all these multiplication values are summed up, it is the weighted average of % progress values of all tasks.
Task weightage is very subjective and can be determined in a variety of ways, using parameters like – task duration, costs, estimated mandays (efforts) etc.
For construction projects, usually it is good idea to use ‘cost’ of a task as a weight factor.
Summary
You can follow these steps to create a planned S Curve for a construction project –
- Create project schedule using a Gantt chart tool
- Extract the planned timeline data for all project tasks to an Excel sheet
- Update the ‘weightage’ factors for all tasks in the same Excel sheet
- Calculate project progress for all dates as weighted average of % progress of different tasks
- Plot the cumulative values of project progress for different dates over project timeline to get the planned S curve.
Plotting Actual S Curve
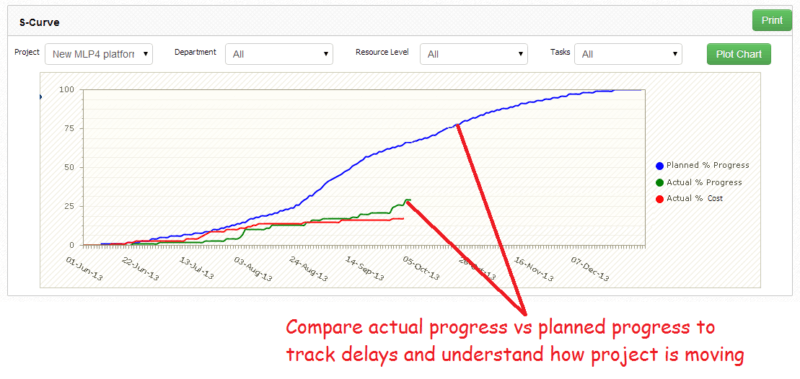
S curve report created with actual progress timeline instead of planned timeline from a Gantt chart, will represent the – Actual Progress S Curve.
Actual S curve indicates the actual cumulative progress of a project over the project timeline (till date).
Similarly if you plot the actual cumulative % costs against timeline, you would get the ‘Actual Cost S Curve’.
But, it takes significantly more time and efforts to plot the ‘Actual S Curve’.
The planned timeline data for a project is easily obtained by going to the project Gantt chart.
Whereas, the actual progress and cost data of a project has to come from multiple stakeholders. Moreover, stakeholders of a construction project – like, architects, engineers, contractors, suppliers etc. – are largely disconnected from each other.
It’s a challenge for a project manager to get progress data from all of these different people and keep doing so on a regular (daily/weekly) basis.
Excel sheets
Normally, project managers use spreadsheets – Excel sheets or shared Google spreadsheets – to track progress info from different stakeholders.
For example, a site supervisor sends a weekly email with Excel spreadsheets containing activity wise details of what happened during past seven days.
Then project manager has to collate all similar spreadsheets received from different stakeholders to get a comprehensive picture of what has actually happened in his project in a given week.
But doing this manually takes up a lot of time and effort. Hence, this type of progress reporting doesn’t actually get done very frequently.
Yes, spreadsheets are very effective and used widely for progress reporting. But emails and spreadsheet are not the best medium for regularly reporting progress data – especially for construction projects.
Mobile Apps
Apart from multiple project stakeholders, the other problem with construction projects is that all these stakeholders and project team members are geographically scattered.
For example – any contractor working on multiple construction sites, will need to coordinate with relevant site supervisors and construction managers.
The site team doesn’t have easy access to spreadsheets.
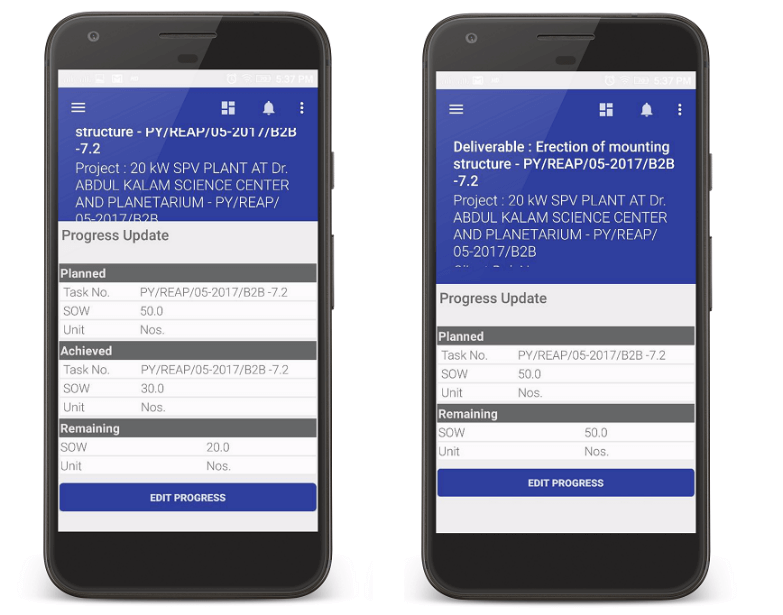
But luckily, we are in the age of smartphones and wireless connectivity. So a construction manager on site can easily use mobile apps on his smartphone to send progress updates – instead of having to go to a laptop to update Excel sheets.

Moreover, mobile app access is so much easier that progress updates can be sent on daily basis, instead of weekly / monthly.
Web based software
Similar to mobile apps, web based software is also quite useful to connect the construction project stakeholders and regularly get progress data from them.
For example, tools like Microsoft Sharepoint OR WorkPack enable project managers to create custom web applications and workflows as required in their work environment.
These web applications can be made accessible to different project stakeholders – like architects, consultants etc. to regularly gather inputs from them.
Putting together all that data
So a construction project manager can use simple tools like – Excel sheets, Google spreadsheets, mobile apps, custom web based software etc. to gather progress and cost updates from all project team members.
Then the challenge is to put all that data together.
It is especially challenging when progress updates come from different sources or if they are in different formats. In such cases a project manager or project engineer will need to spend significant manual efforts to collate all that data.
A better alternative is to use a single digital platform where different stakeholders can connect and record progress data for project activities. And then the same platform should automatically collate that data and put it in S curve format.
WorkPack is one such digital platform which can be accessed by project team members using different devices – web browsers, PC, mobile phones, tablets etc.
WorkPack connects simple to use tools like – emails, spreadsheets, mobile apps etc. on a single platform.
![]()
So your project team members can use any tools they are comfortable with – spreadsheets, emails, mobile apps etc. to send progress updates.
And then WorkPack will put together all their progress updates in ‘Actual S Curve’ format.
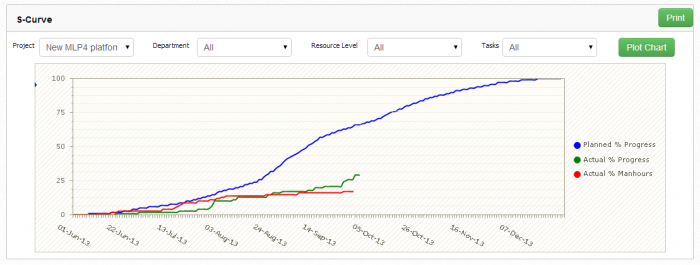
WorkPack also integrates the project schedule on the same platform. So the actual S curve prepared on WorkPack can be readily compared with the planned S curve for the same project.
Looking at the planned and actual S curves on the same screen will quickly tell you how your project is performing against the initial plans.

The connectivity and reporting capabilities of WorkPack have already helped construction project managers across different industries.
Do you think your team can benefit as well? Find out by setting up a free trial account.
Let us know in case of any questions OR if you would like to set up a free consulting session to understand how it all works.


1 Comment
Leonard Byrd
July 10, 2018
One only has to look at your planned “S” curve to know you have a bad schedule. There are only two basic planned “S” curves required a on a construction project. They are a 10% (For complex and difficult projects and a 15% for more basic or simple) That means at 25% of the expended time period your planned progress is either 10% or 15% depending on the project complexity and consequently at 75% of the time expended you will be 85% for simple and 90% for complex. This is simple logic as in the first quarter of a project you are getting started and opening opportunities for progress so you wouldn’t expect to be at optimum progress the day you break ground. It takes a while to man-up and create the opportunity for peak staffing and optimum progress. Once you hit the 25% time and all the way up to the 75% you should have opened enough work areas, have enough staff and flexibility to see straight line optimum progress. Consequently at 75% time you are closing out areas, compressing work opportunity and overstaffing work areas so productivity will decrease similar to the front end of the project. Once you understand the space, opportunity and staff constraints inherent with construction project you will be able to recognize flawed software. The example in this post indicated 65% of the time elapsed with only 25 % complete – not a good project example.